Goal Component
React Dash allows you to define goals to accomplish and are measured against the data. Goals be displayed by increase, decrease, maintain or measure.
{
  type: 'GAGoal',
  title: '',
  caption: 'number of schools enrollments',
  link: 'http://tootherplace.com',
  icon: 'glyphicon-gbp',
  startDate: '03/24/2016',
  endDate: '04/24/2016',
  startNumber: 0,
  endNumber: 200,
  action: 'increase',
  background: 'white',
  // trackStatus: 'function',
  tolerance: [
    {from: 0, to: 2, label: 'On Track', color: 'green'},
    {from: 2, to: 5, label: 'Needs Improvement', color: 'orange'},
    {from: 5, to: Infinity, label: 'Off Track', color: 'red'},
  ],
  spline: {
    height: 50,
  },
  fetchData: {type:'function', name: 'getData'},
  metric: 'getRandomMetric'
}
Available settings
- caption: caption text using in the component. Only plain text is allowed.
- link: a url to redirect users when they click in the goal.
- startDate: date when you start to messure your goal
- endDate: date when you needs to reach the goal.
- startNumber: amount of units you start with.
- endNumber: amout of units you want to reach.
- action: the action you want to accomplish.
There are 6 possible values:
- increase: your goal is to increase the number of units. If the number of units are equal or greater than the endNumber then goal is on track.
- decrease: your goal is to decrease the number of units. If the number of units are equal or lower than the endNumber then goal is on track.
- maintain_above: this action is very similar to the increase action except startNumber and endNumber should be set at the same number.
- maintain_below: this action is very similar to the decrease action except startNumber and endNumber should be set at the same number.
- measure: in this case you don’t want to reach a goal but just display a mesure.
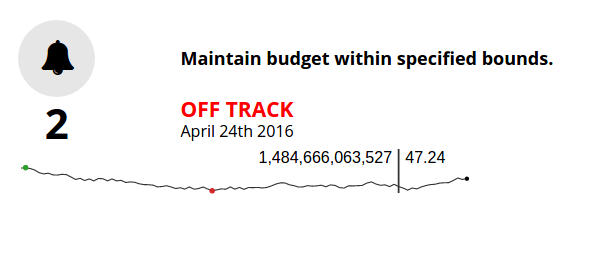
- tolerance: allow you to define a tolerance to define the status of your goal.
Let’s take a look at the above example. In that case if your deviation is between 0 and 2 then the OnTrack label will be displayed because the first item of tolerance will be selected.
Deviation is computed by projecting the number of units based on the startDate, endDate and endNumber and using a linear function. You can override the getTracker and the trackStatus functions if this projection doesn’t fit with your needs.
- spline: you can choose to additionally show a spline chart below the goal. If you choose to display the goal then you can set an object with the configuration needed to display the spline (e.g.: height).