Chart Component


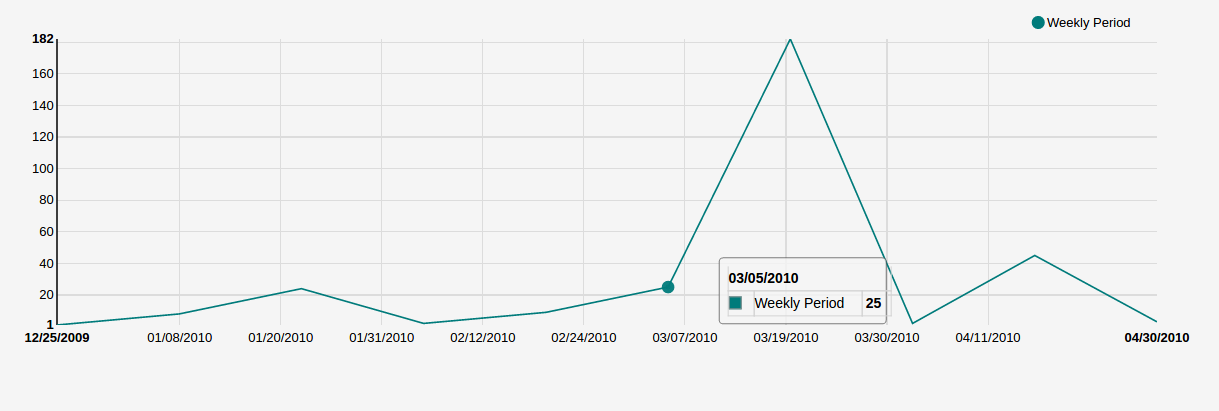
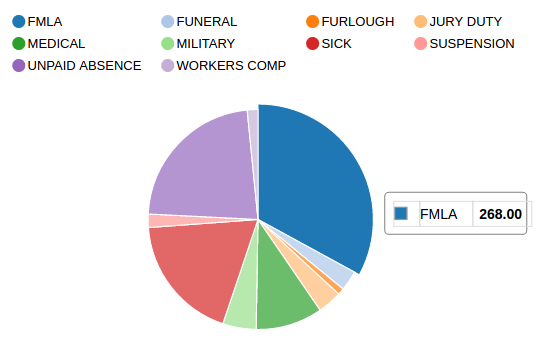
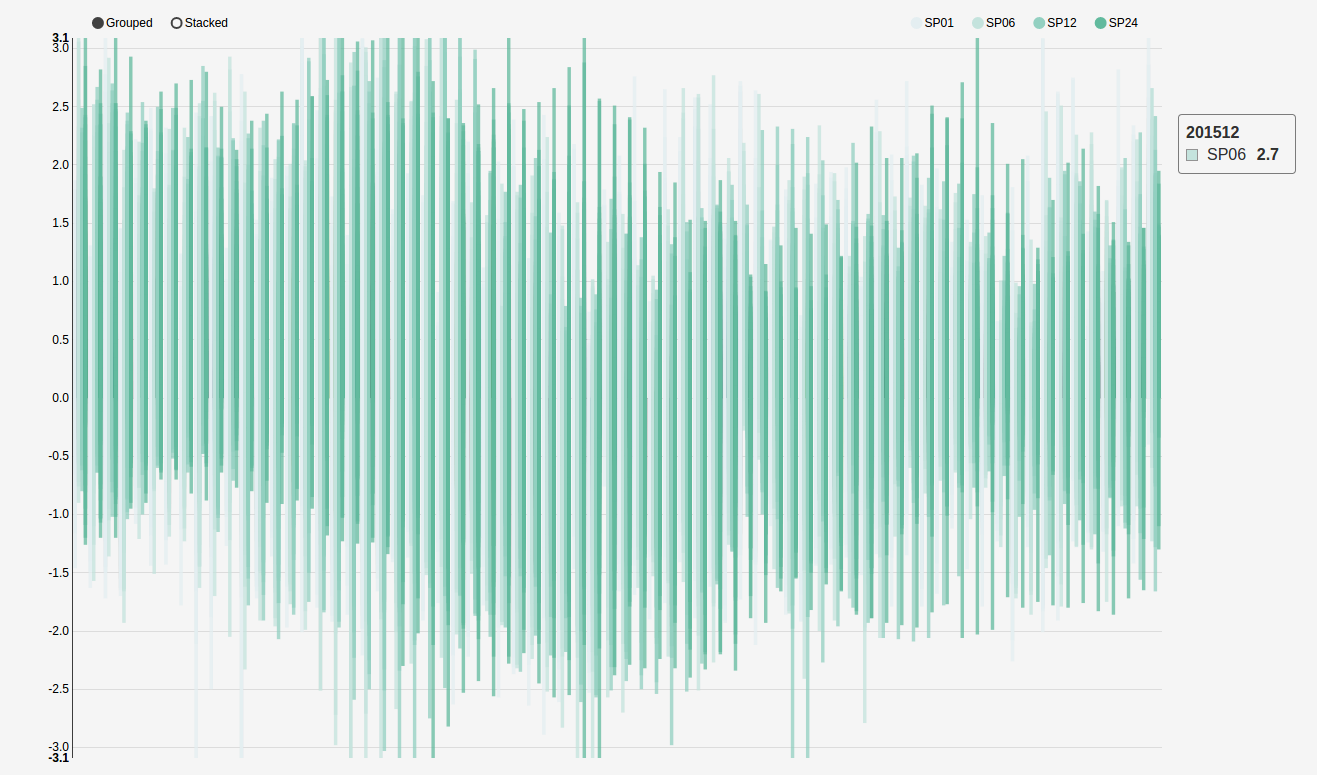
Chart component is a wrapper of the react-nvd3 library (@@LINK), which is also a wrapper of the nvd3 chart library. That meanas all the charts and options available in nvd3 are also available in this component.
{
  header:'Top',
  type: 'GAChart',
  iconClass: 'glyphicon glyphicon-tree-conifer',
  settings: {
    id:'lineChart2',
    type: 'discreteBarChart',
    x: 'label',
    y: 'value',
    height: 340,
    margin: {
      left: 38
    },
    color: ['#EA7E7E']
  },
  dataHandlers: ['getChartDaqta']
}
Notice that all the chart configuration goes inside the settings object.
If the x and y columns on your data already have the names you want, then you don’t need to specify the x and y settings.
Available settings
- settings Settings are passed the React NVD3 module. See React NVD3 documentation
- data If raw data is being passed, data should be formatted as per the NVD3 data requriments which vary based on chart type. See the NVD3 documentation and examples which oultine the proper shape for data.
- dataHandlers If you are using the react-dash internal data handling, make sure to pass data to one of the NVD3 Data Handlers as the final step of your data handling pipeline